Explore How to Generate Infographics Free with AI Tools, beginning with an in-depth introduction to their fundamentals, followed by insights into powerful AI tools, real-world applications, and practical examples.
Introduction to Infographics
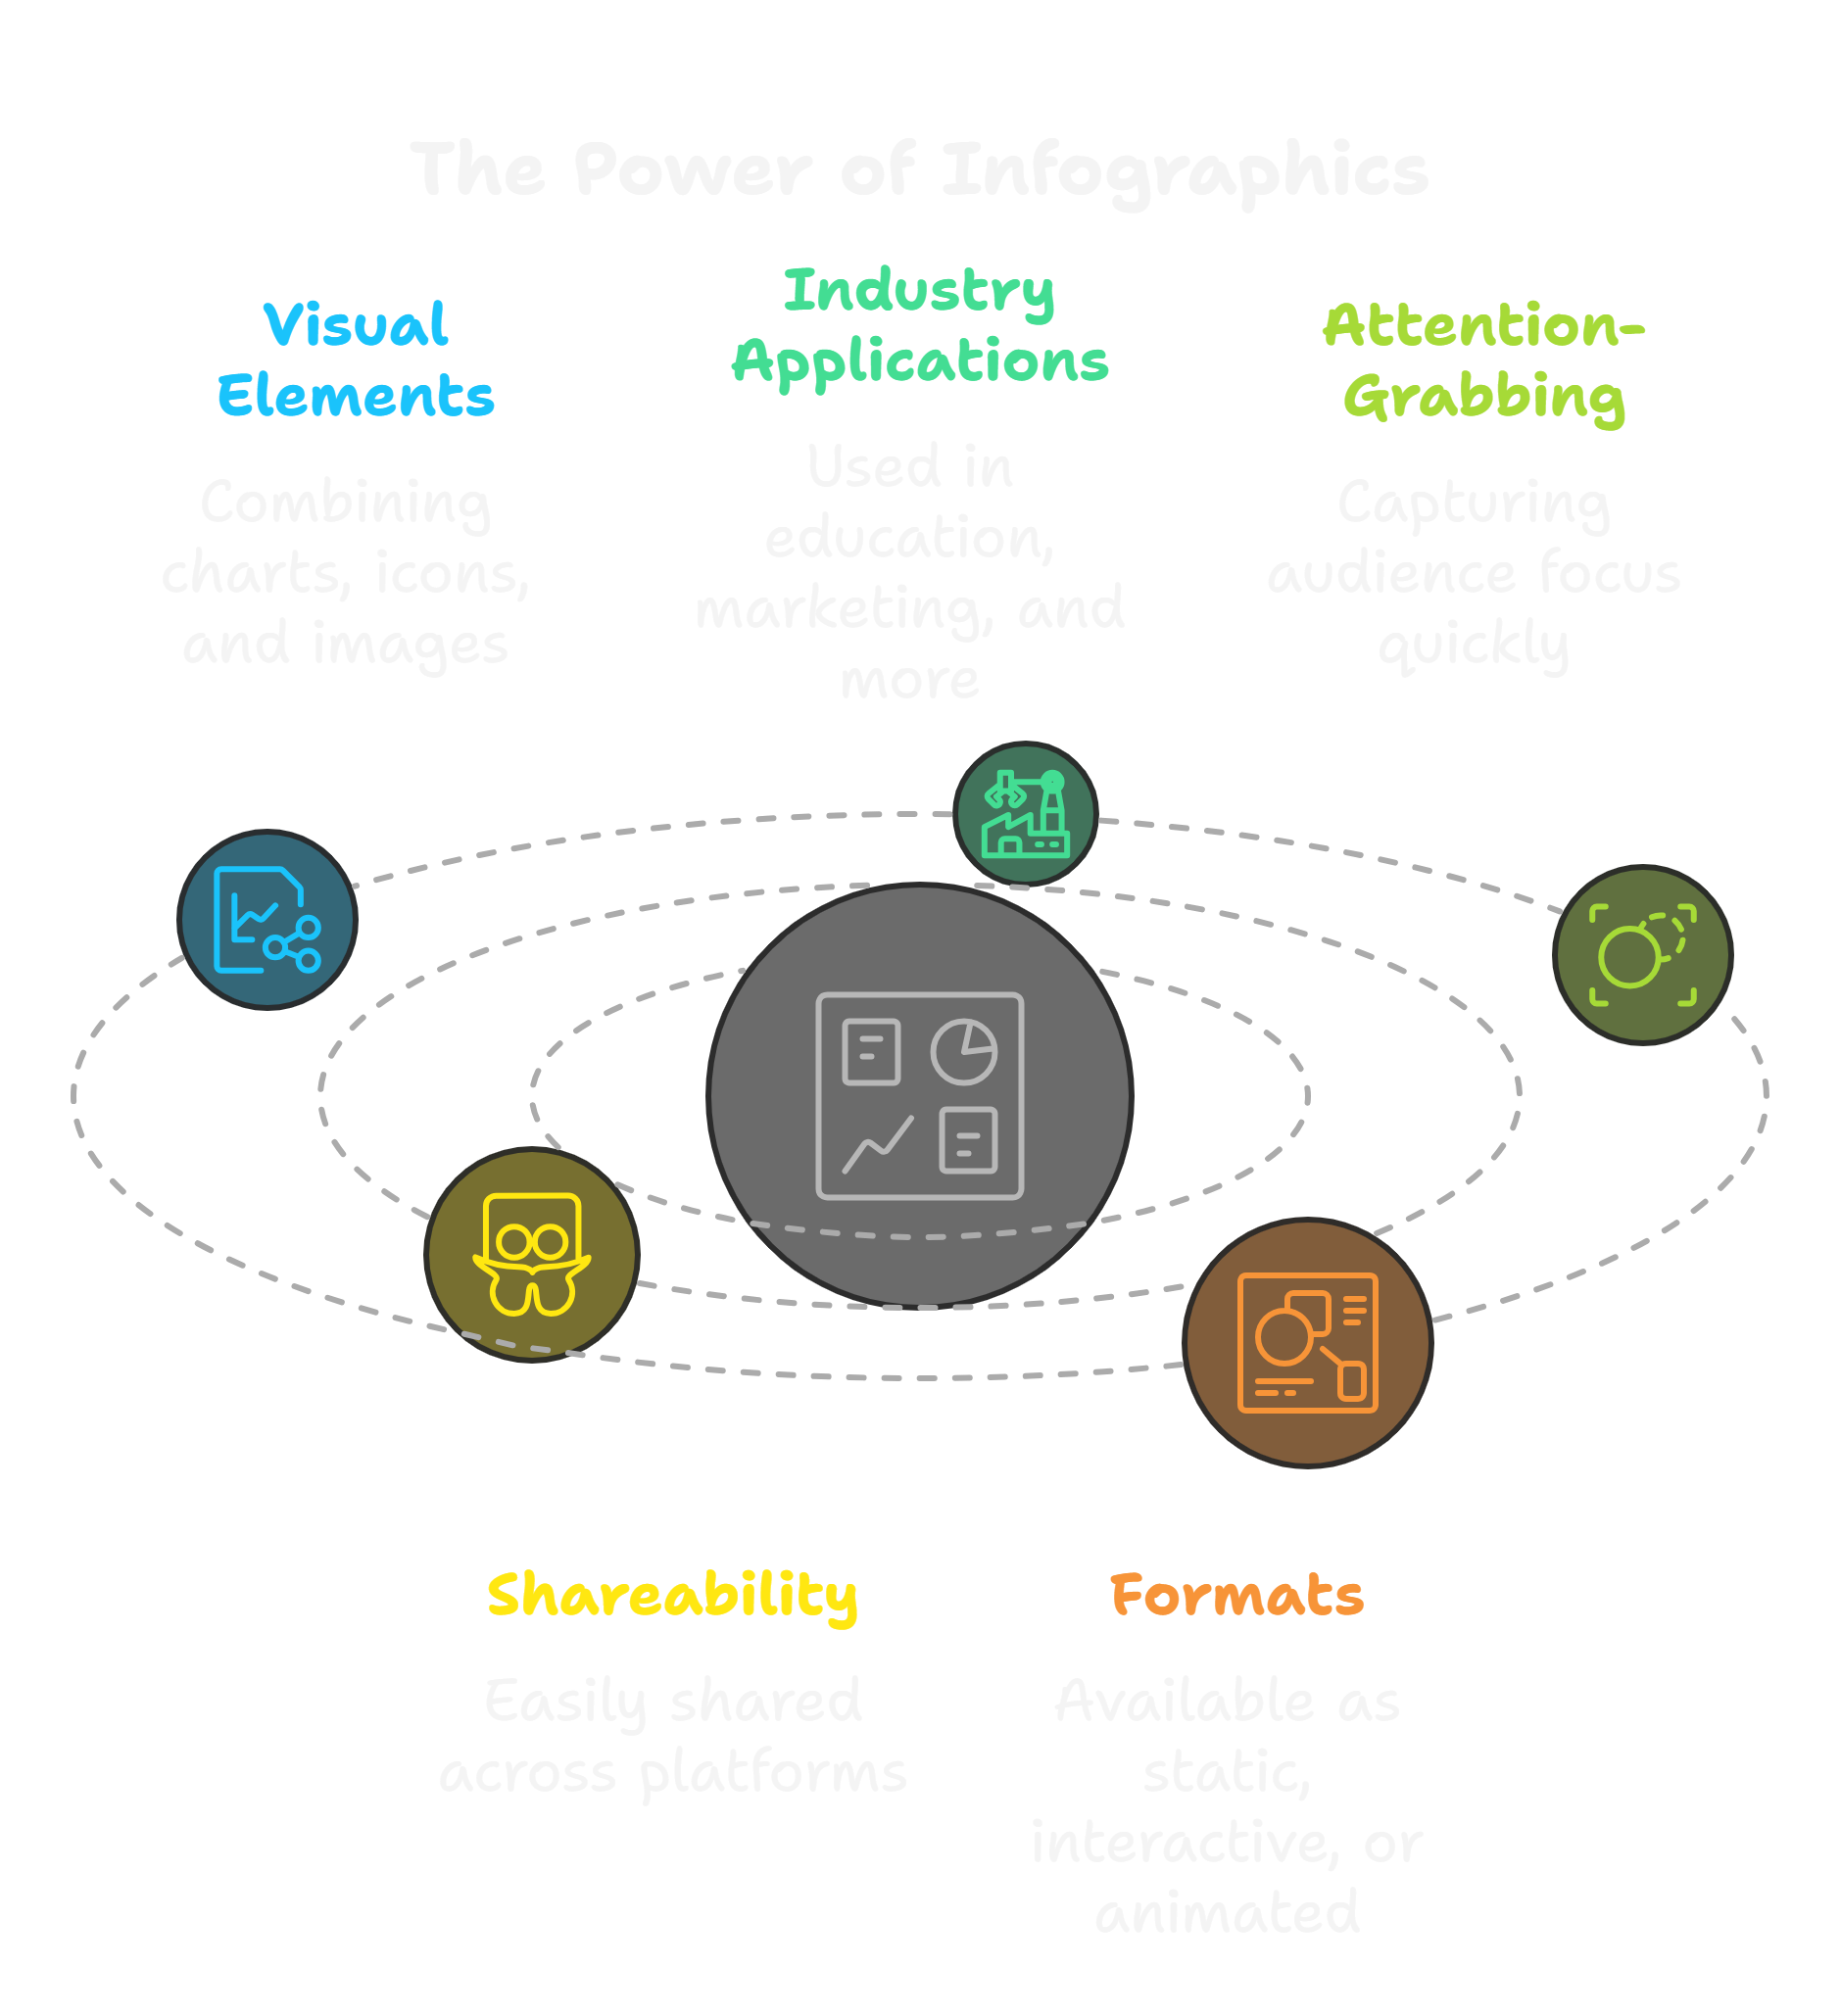
Infographics can be defined as a visual presentation of information, data, or knowledge to give complex ideas a simple, interesting, and digestible look. They combine elements like charts, icons, images, and concise text to communicate a message effectively. Infographics are used across various industries, such as education, marketing, journalism, and business, as they can transform dry or complicated information into visually appealing and memorable content.
Fast and quick capture of attention and simultaneous conveyance of information at one’s glance – this is the power of infographics. As people are increasingly getting bombarded with the tsunami of online content, infographics help them cut through it and provide value to readers in an efficient manner. Thus, an example would include a well-crafted infographic that summarizes an entire report into one image, which readers will find easier to understand without reading lengthy text.
Infographics are also very shareable, making them perfect for social media, blogs, and presentations. They come in various formats, including static images, interactive graphics, or even animated ones. This makes infographics an excellent tool for anyone who wants to engage his audience and convey ideas effectively.
Traditional Creation of Infographics (Without AI Tools)
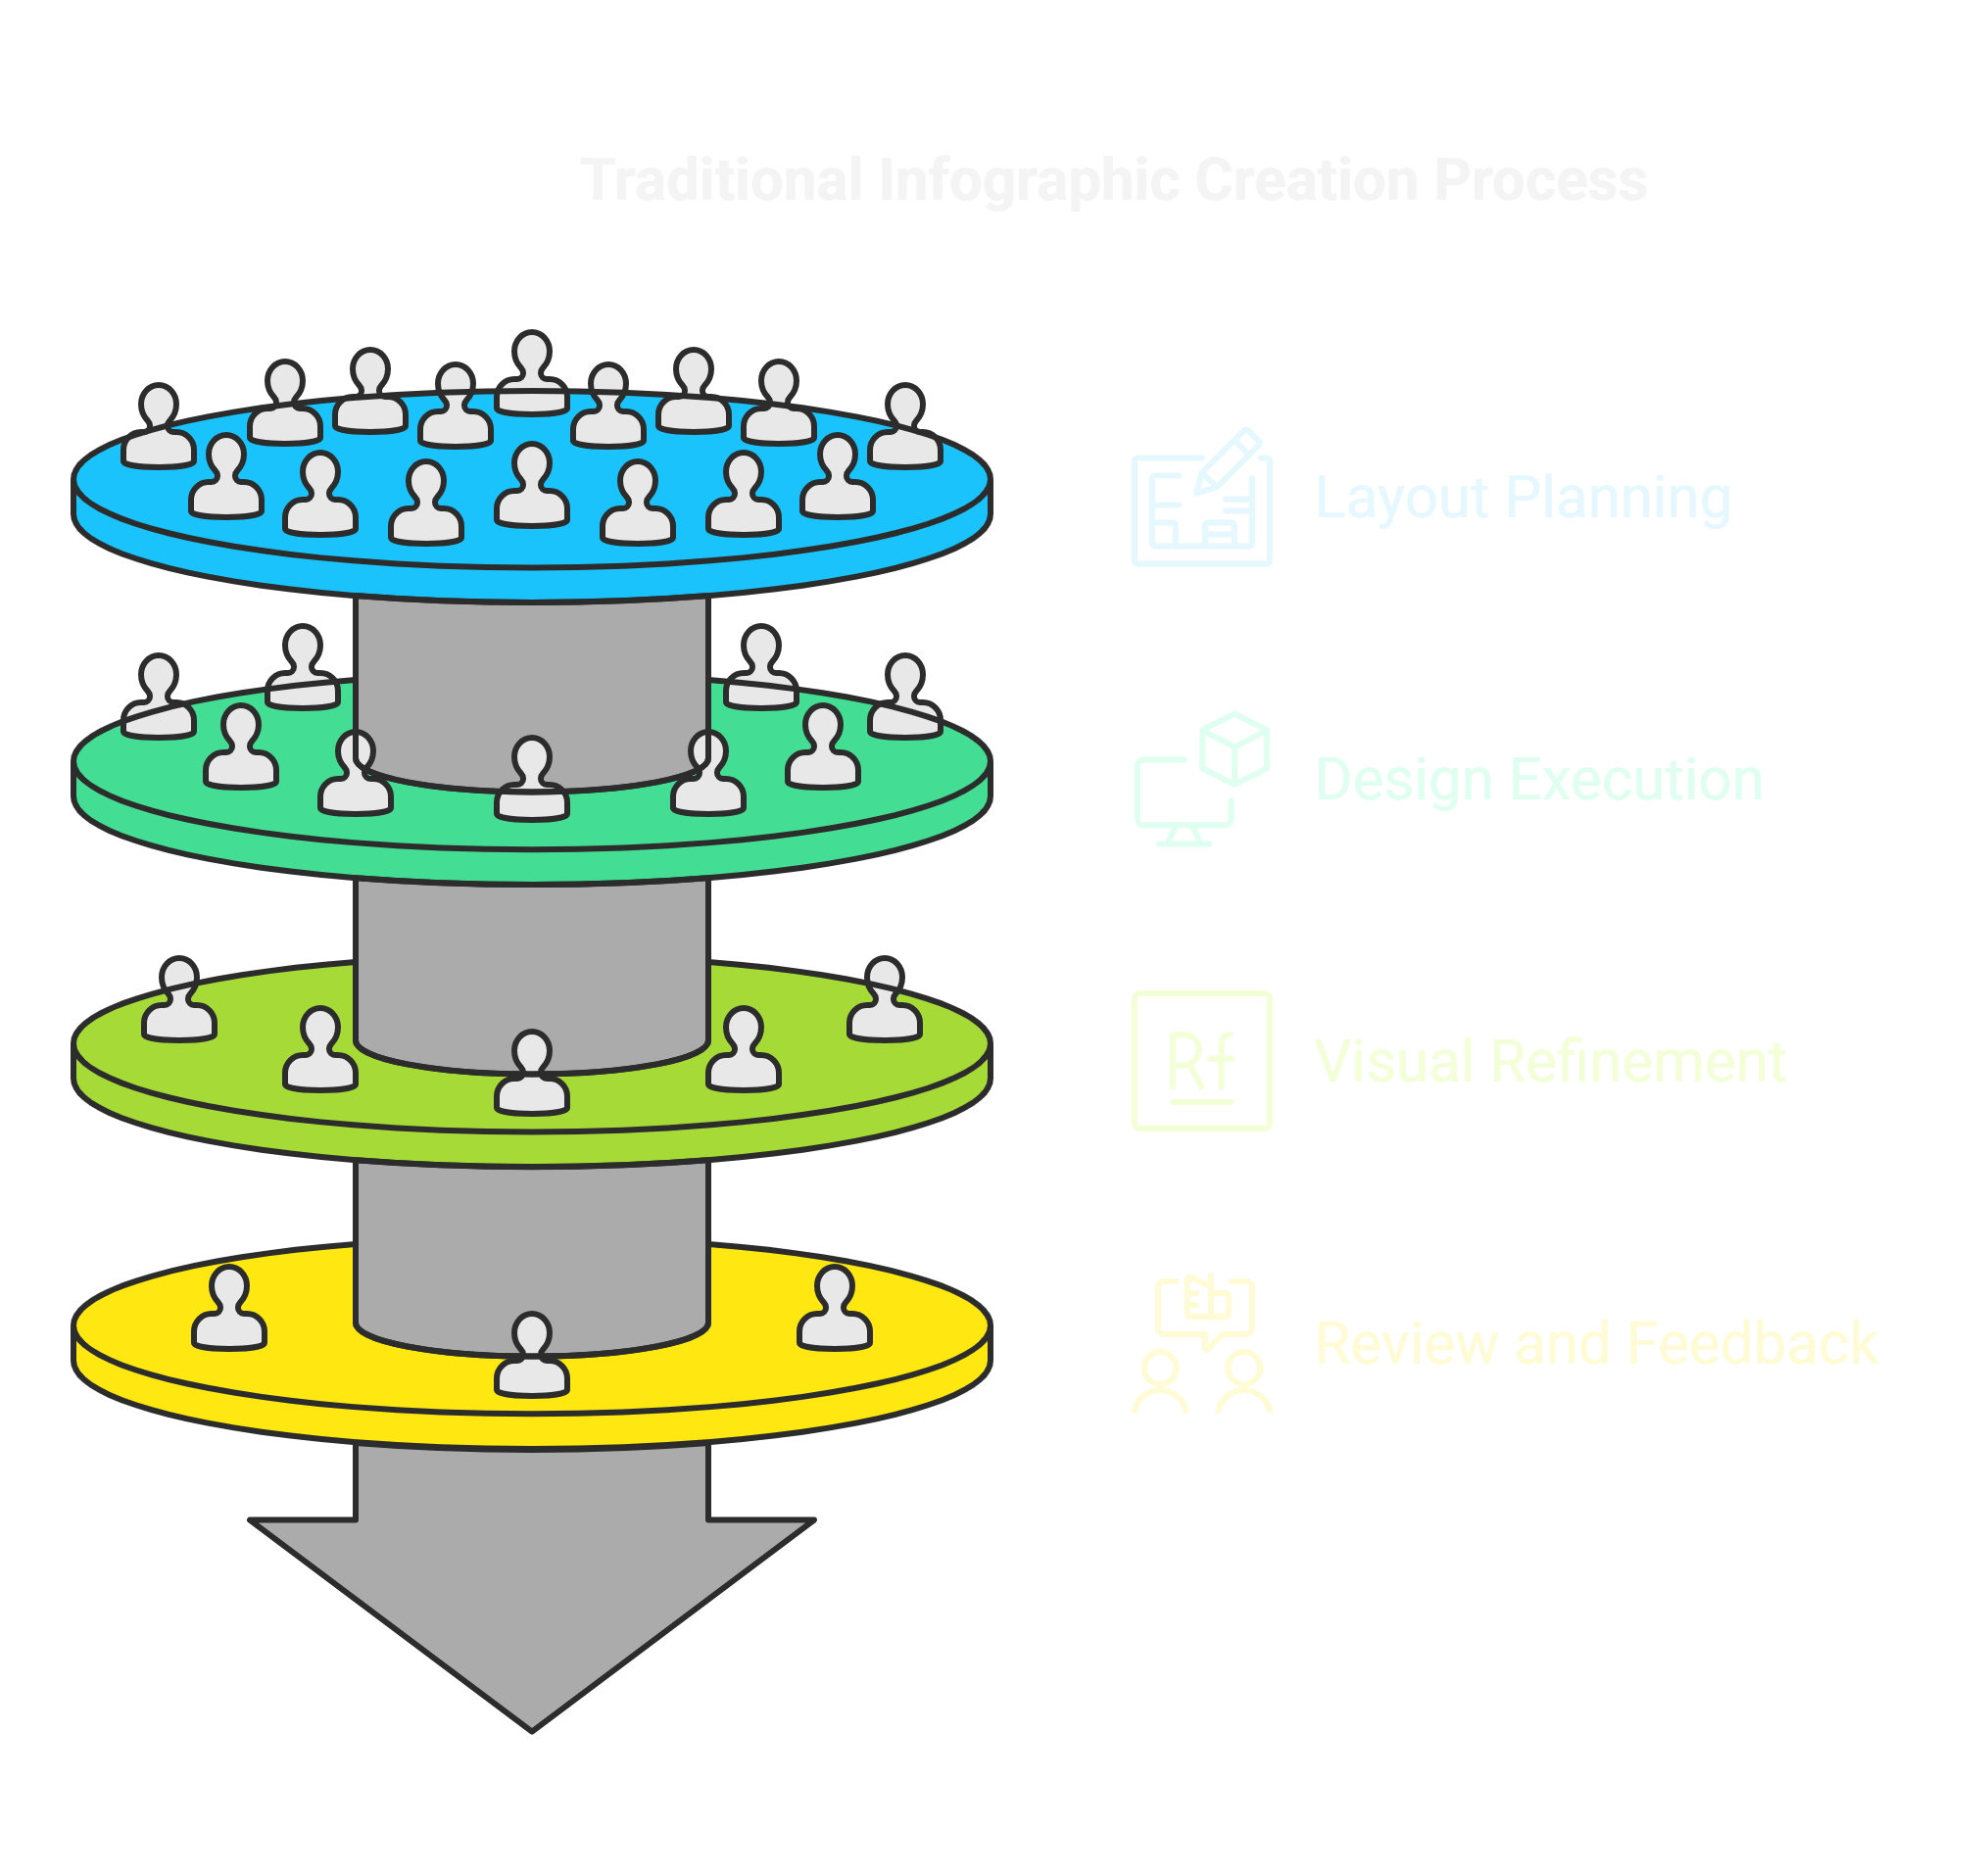
Hand creation of infographics can be very time-consuming, yet very rewarding. Infographics traditionally have always required creativity, technical skill, and good knowledge of the presented content. The main steps to making an infographic by hand are:
1. Research and Content Gathering:
The very first step is that of collecting data and information relevant to the content. This may include reading reports or conducting surveys to gather statistics from authentic sources. The necessity is that the content must be apt and correct for the needs of the audience.
2. Layout planning:
Once all data is prepared, the designer will plan the layout and structure of the infographic. Sometimes designers sketch out a rough draft so they can get an idea of how it’s going to be. Main questions include: headlines, charts, icons, etc.
3. Tools:
Infographics are mostly created using traditional graphic design software; Adobe Illustrator, Photoshop, or CorelDRAW. The tools are designed with enough customization options, but also with much time as well as expertise to master.
4. Design and Customisation:
This step will involve choosing the right color palette, font size, and other visual elements to fit the message and branding. The infographic should be designed in a well-balanced manner that is easy to read without clutter or the overuse of complex graphics.
5. Review and Refine:
After having designed the initial draft, reviewing and refining the infographic is vital. It would involve reviewing the text for any grammatical errors, checking the data for inaccuracies, and ensuring your visuals connect to the required message.
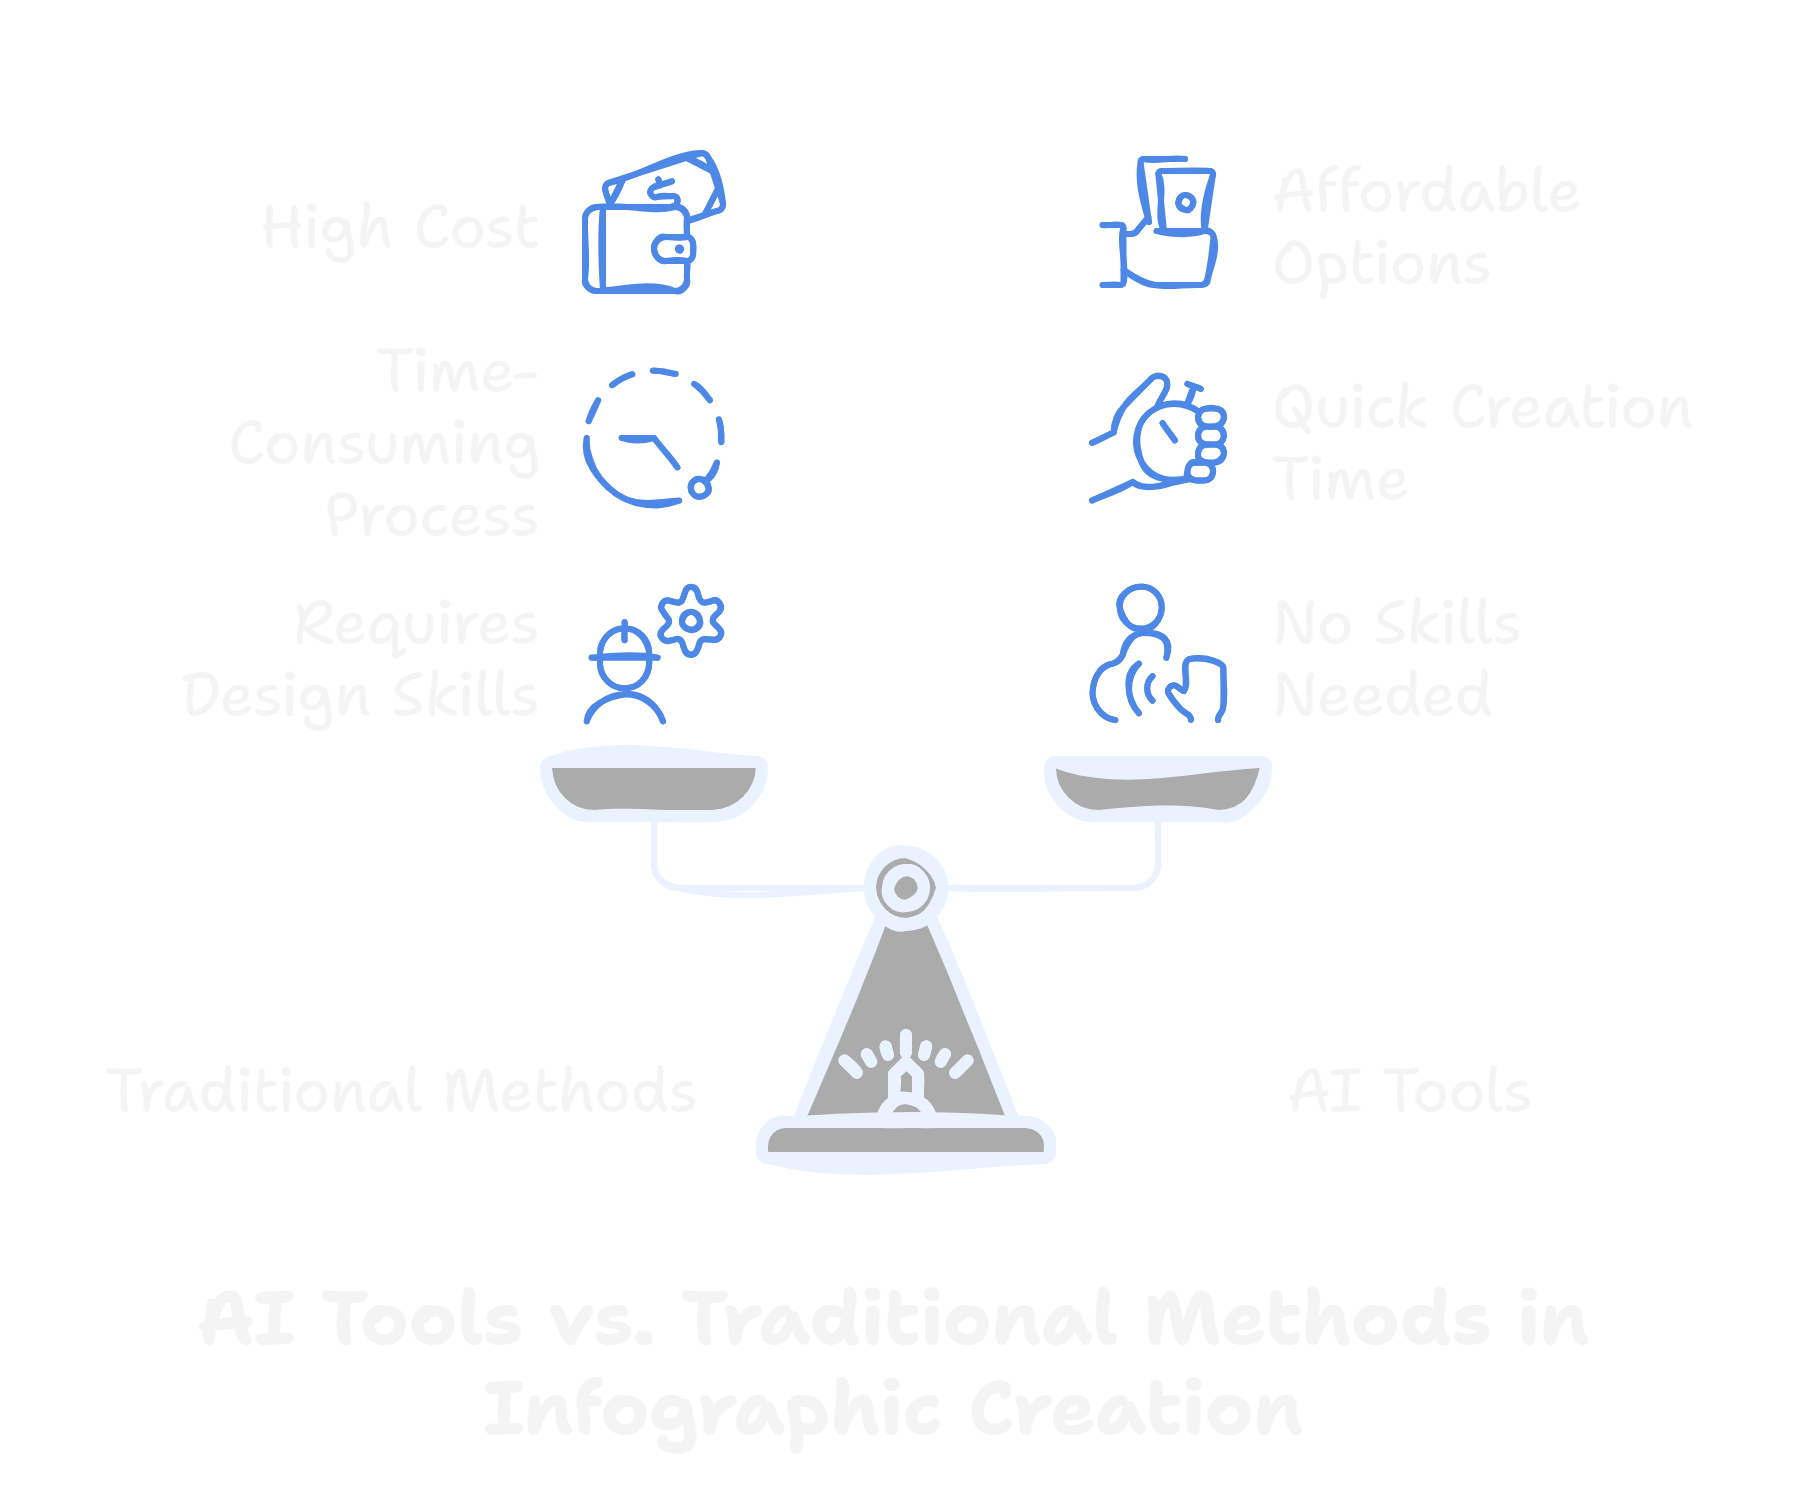
Feedback from colleagues or clients helps refine the output. While traditional approaches provide full control over creativity, they are resource-hungry. Not everyone can allocate time or knowledge to create mind-blowing infographics. That is when AI tools save the day.
The Rise of AI Tools for Infographics
The artificial intelligence emergence has revolutionized many industries with graphic design being at the forefront. In the recent past, AI has made creating infographics a rather easy and accessible task; therefore, it is becoming an essential tool in the making of infographics. Here’s why AI tools can no longer be ignored.
1. Accessibility and Ease of Use:
AI-based tools do not require a very detailed design understanding. They allow users to build professional-quality infographics with ease because of their ease-of-use interface. There are pre-made templates, drag-and-drop elements, and modification options that streamline the process for anyone.
2. Time Efficiency:
Unlike traditional methods, AI tools significantly reduce the time required to create infographics. By automating tasks like layout design, color matching, and font selection, these tools enable users to focus on the content rather than technical details. This is especially valuable for businesses and individuals working on tight deadlines.
3. Customization and Flexibility:
AI tools offer numerous templates and design options, and they are adaptable to different styles and industries. Users can easily customize templates to fit their branding and add logos, icons, and other elements with just a few clicks. Some tools also offer AI-generated suggestions for improving the design.
4. Affordability:
Many AI applications offer free editions or low-priced paid plans that reach the individual’s and small company’s tight budget. They also differ from standard design applications since most charge licenses that may not be easily affordable.
5. Continuity of Inventions:
AI is continuously under improvement, creating newer features that might include real-time collaboration, deeper analytics, and even voice-to-designing features. This, in turn, improves user experience and further unlocks the doors for creating highly interactive and compelling infographics.
This process of creating an infographic has, therefore, democratized how such infographics can be produced; users with no or low levels of skill can create high-quality visuals with minimal effort. As these tools evolve further, they will likely play a greater role in how we visually communicate and share information.
Introducing Napkin AI
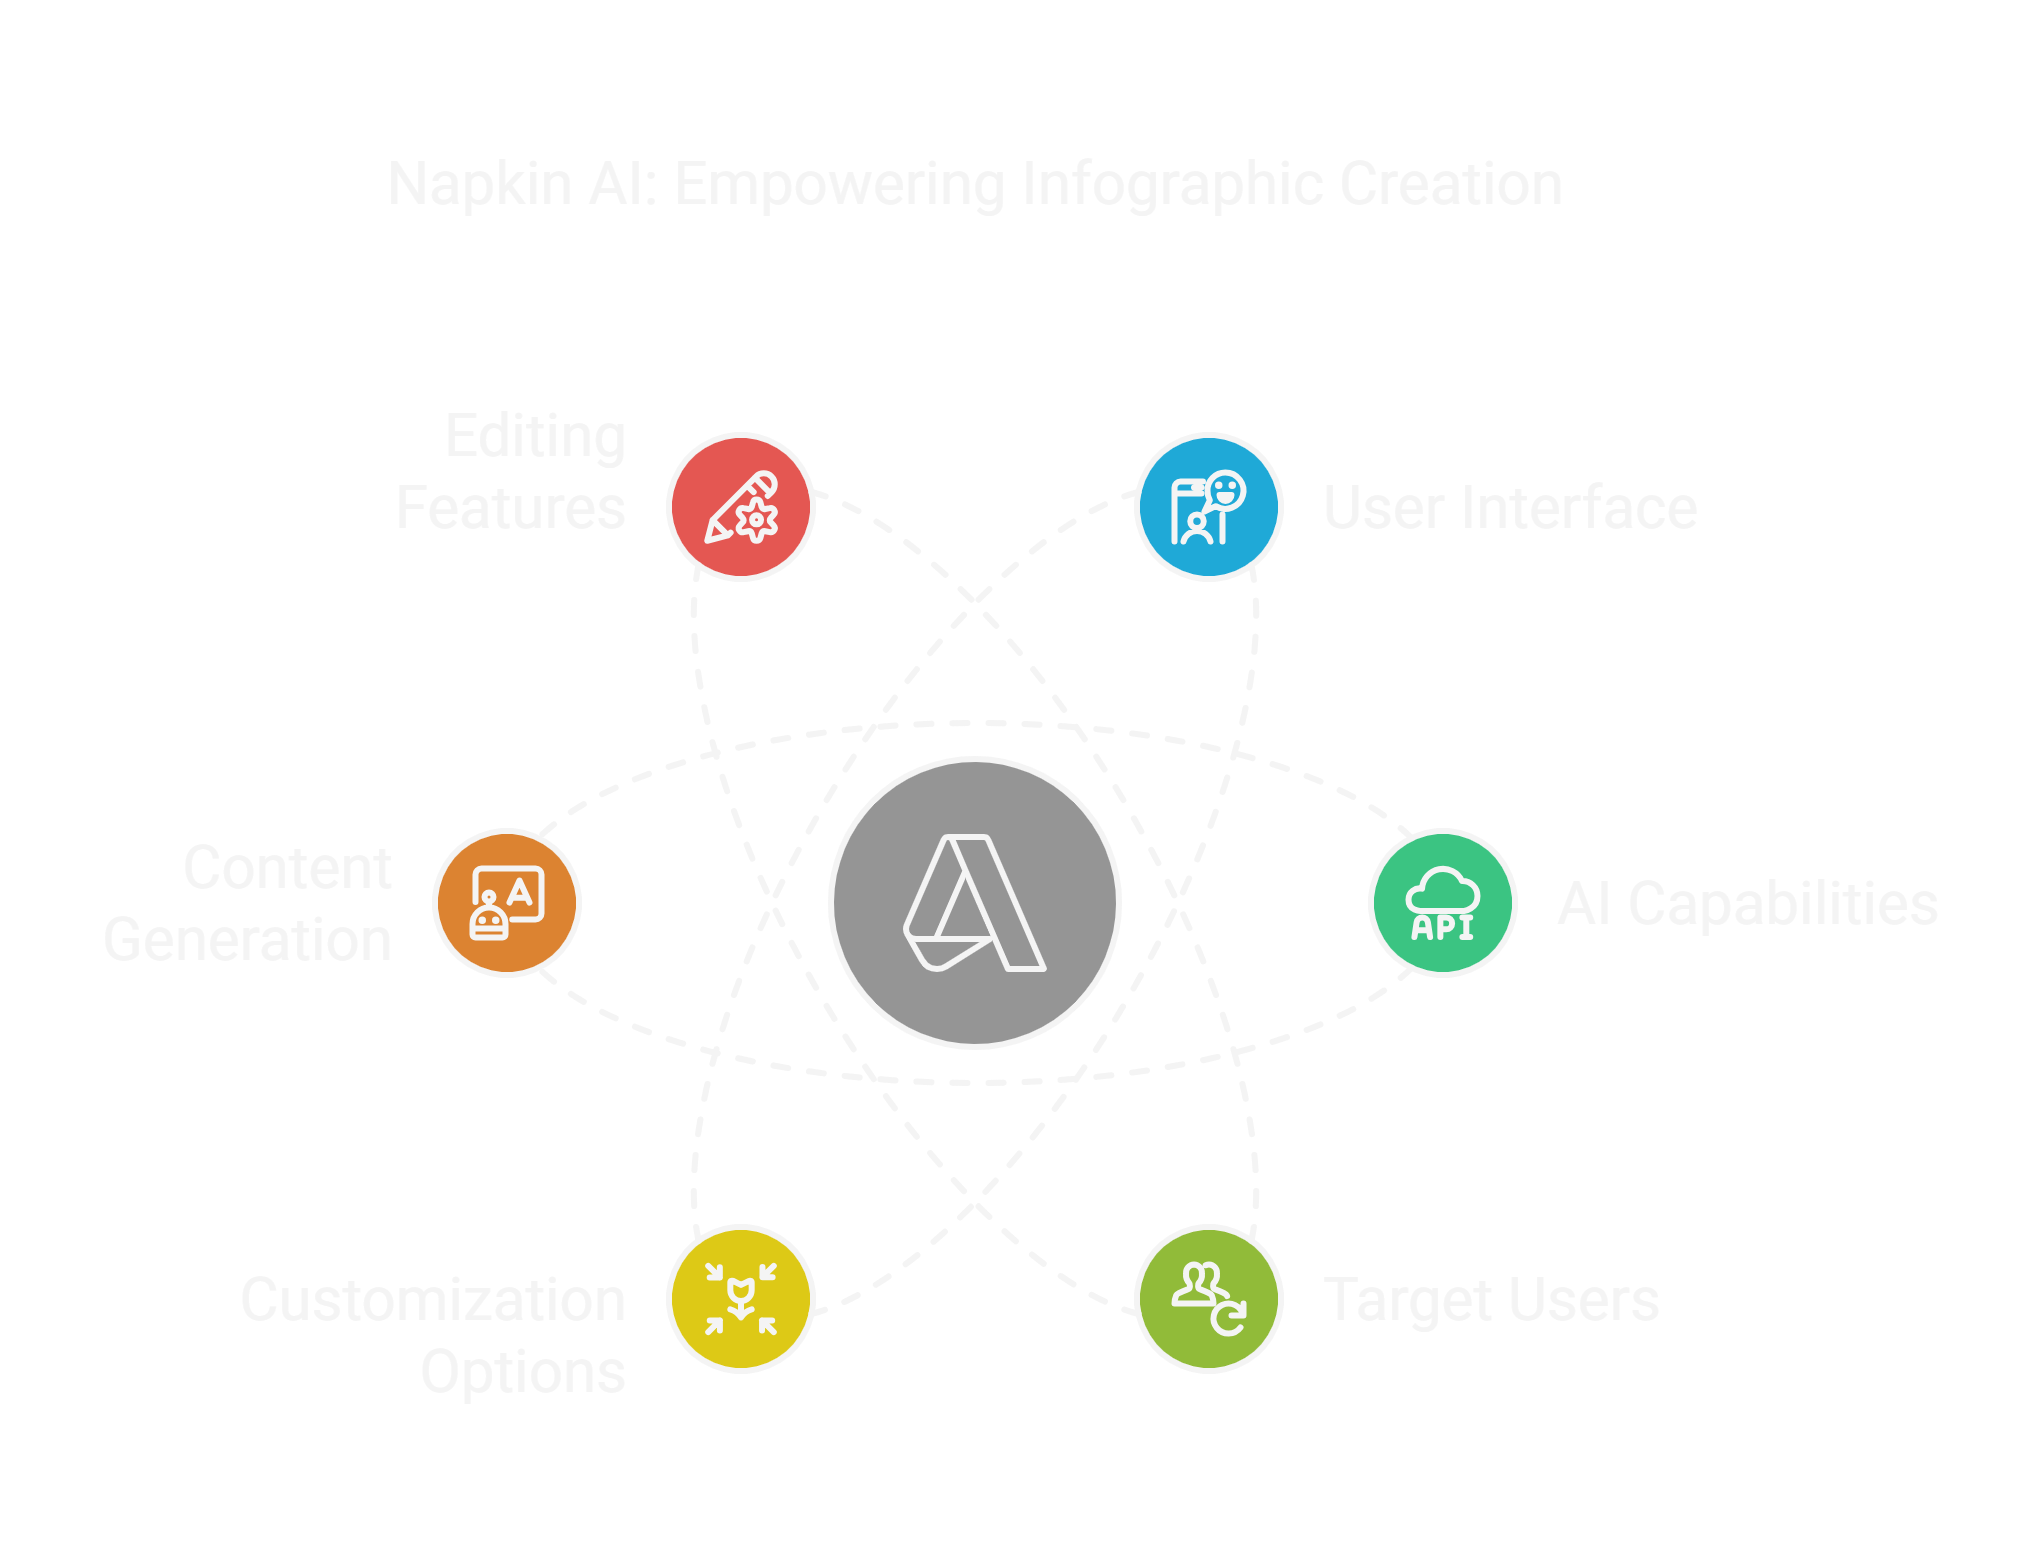
Napkin AI is the innovation created to make creating high-quality infographics as effortless as possible. With its friendly user interface and high-end AI capability, Napkin AI helps designers design very impressive infographics quite easily. No matter if you’re a novice designer or a skilled one, the tool guarantees generating infographics for free using AI tools at the right pace.
Napkin AI is ideal for content creators, educators, marketers, and anyone else who needs professional visuals without having to be a designer. The platform aims to make infographic creation accessible to everyone. It provides a lot of customization options so that users can create infographics according to their needs. From generating content based on prompts to editing every aspect of the infographic, Napkin AI makes creating impactful visuals seamless.
Features of Napkin AI
Napkin AI is packed with powerful features that make it a standout tool for infographic creation. Let’s explore its capabilities in detail:
Account Setting and Accessibility
The first aspect of using Napkin AI will be to first create an account. If an account already exists, then proceed to log into the system; the onboarding process is simple for users to just get started without trouble.
Main Landing Page
Once logged in, users are directed to the main landing page, where the primary option is to “Create a Napkin.” In this context, creating a napkin means designing an infographic. This intuitive approach makes it easy for users to navigate the tool and start their projects immediately.
Prompt-Based Content Generation
Napkin AI allows users to input prompts or headings to generate text automatically. The AI processes the input and creates well-structured content. Each paragraph and heading comes with a lightning bolt symbol, which users can click to generate an infographic instantly.
Infographic Options
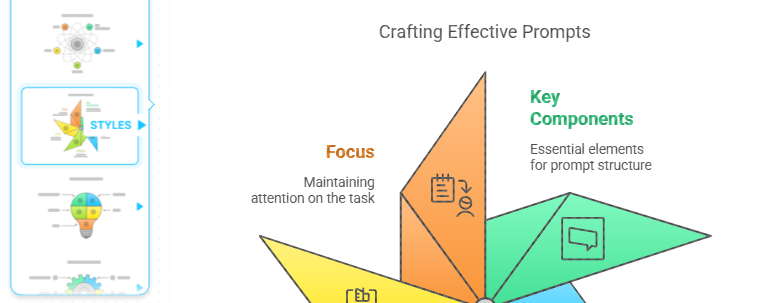
For every prompt, Napkin AI offers an average of 5–6 infographic styles. If these options don’t meet the user’s requirements, additional styles can be generated. This variety ensures that users always find a design that suits their preferences.
Editing Capabilities
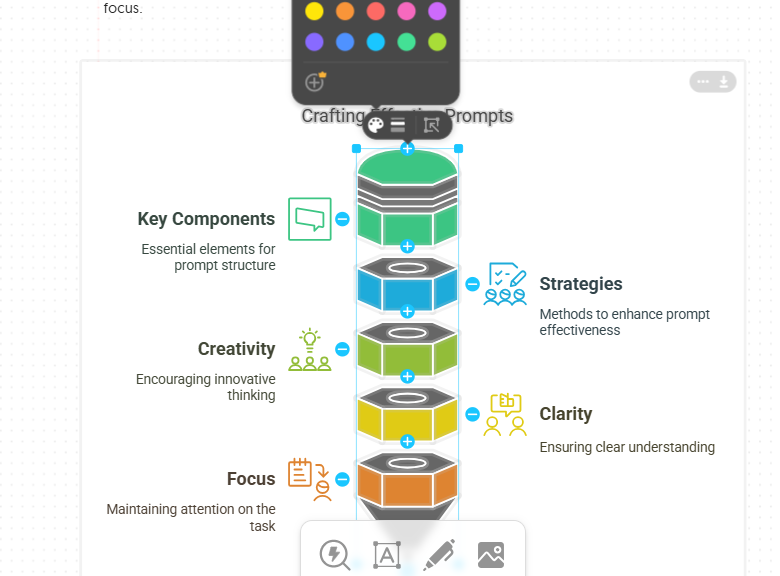
One of Napkin AI’s strongest features is its robust editing tools. Users can edit text, diagrams, and images within the infographic. The editing options include:
- Changing text colors, fonts, and styles (e.g., bold, underline).
- Sketching or adding annotations directly onto the infographic.
- Uploading images from the media library or pasting images from external sources.
- Modifying the style of diagrams and text layouts.
Aspect Ratio Customization
Users can adjust the aspect ratio of their infographics to fit different platforms and purposes. Available options include:
- 1:1 (Square)
- 16:9 (Widescreen)
- 4:5 (Vertical)
Export Options
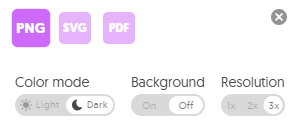
Once the infographic is finalized, Napkin AI provides multiple export options, allowing users to save their work in various formats and settings. These options include:
- File Formats: PNG, SVG, PDF.
- Color Modes: Dark or light.
- Background: On or off.
- Resolution: 1x, 2x, or 3x.
Create Infographics Using Your Text
A user can input his/her text and create infographics from that text using Napkin AI. Instead of just relying on the AI-generated content, users may directly paste their custom text into the tool and click on the lightning bolt icon to generate an infographic.
That feature is fantastic for individuals or businesses that have already prepared their specific content but desire to visualize it in a much more engaging form. Whether it is a heading, paragraph, or an entire document, Napkin AI rapidly turns your text into high-quality, customizable infographics, making it the perfect tool for personalized visual content creation.
Practical Steps to Use Napkin AI
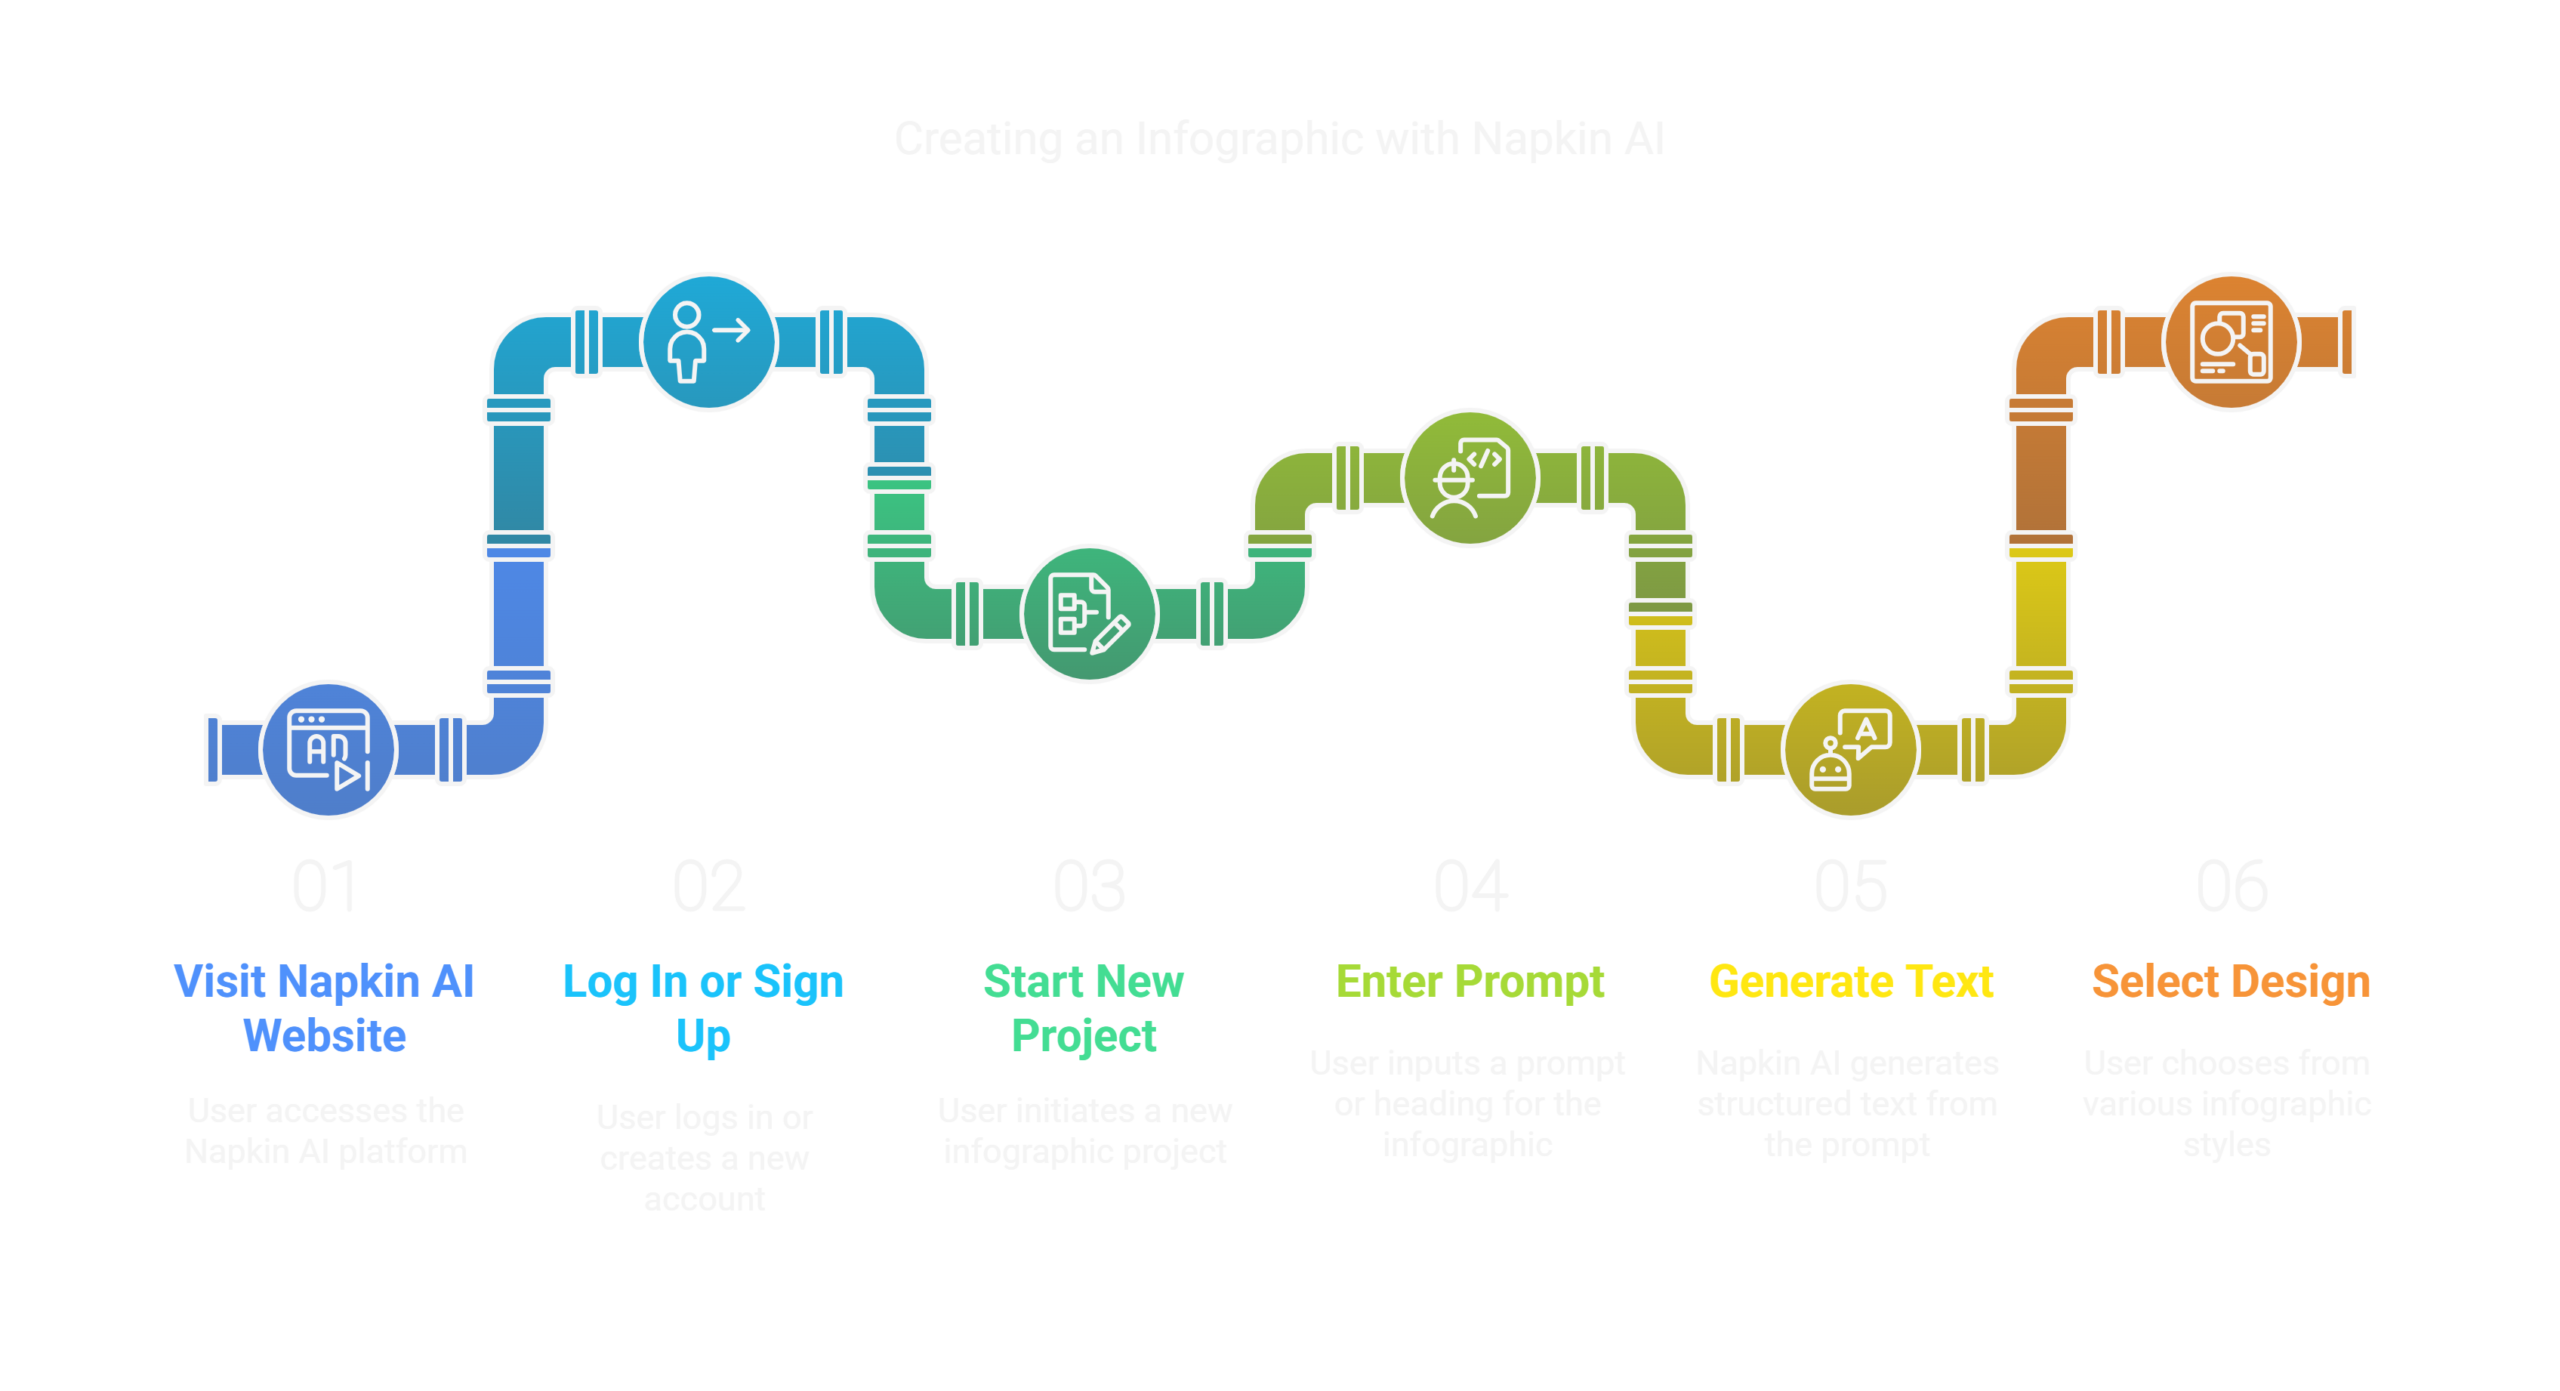
To demonstrate the functionality of Napkin AI, let’s walk through the process of creating and editing an infographic in 4 simple steps:
Create an Account and Log In
Begin by visiting the Napkin AI website. If you’re a new user, sign up for an account. Existing users can log in directly. Once logged in, navigate to the main landing page.
Generate Content with a Prompt
Click the “Create a Napkin” button to start a new project.
Enter a prompt or heading.
Napkin AI will generate structured text based on your input. Each heading and paragraph will have a lightning bolt icon. Clicking on this icon generates infographic designs.
Select and Customize an Infographic
Choose from the 5–6 infographic styles provided by the tool. If none are suitable, generate additional options.
After selecting your desired infographic, use the editing tools to customize it. Modify text, adjust colors, add diagrams, and upload images to enhance the design.
Change the aspect ratio to fit your needs (e.g., 16:9 for presentations).
Export the Infographic
Once satisfied with the design, proceed to export.
Select the file format (PNG, SVG, or PDF), color mode (dark or light), background option, and resolution (1x, 2x, or 3x).
Download the infographic in your chosen format, ready for use.
Practical Example:
To test Napkin AI, I entered the prompt
“How to transcribe audio to text“.
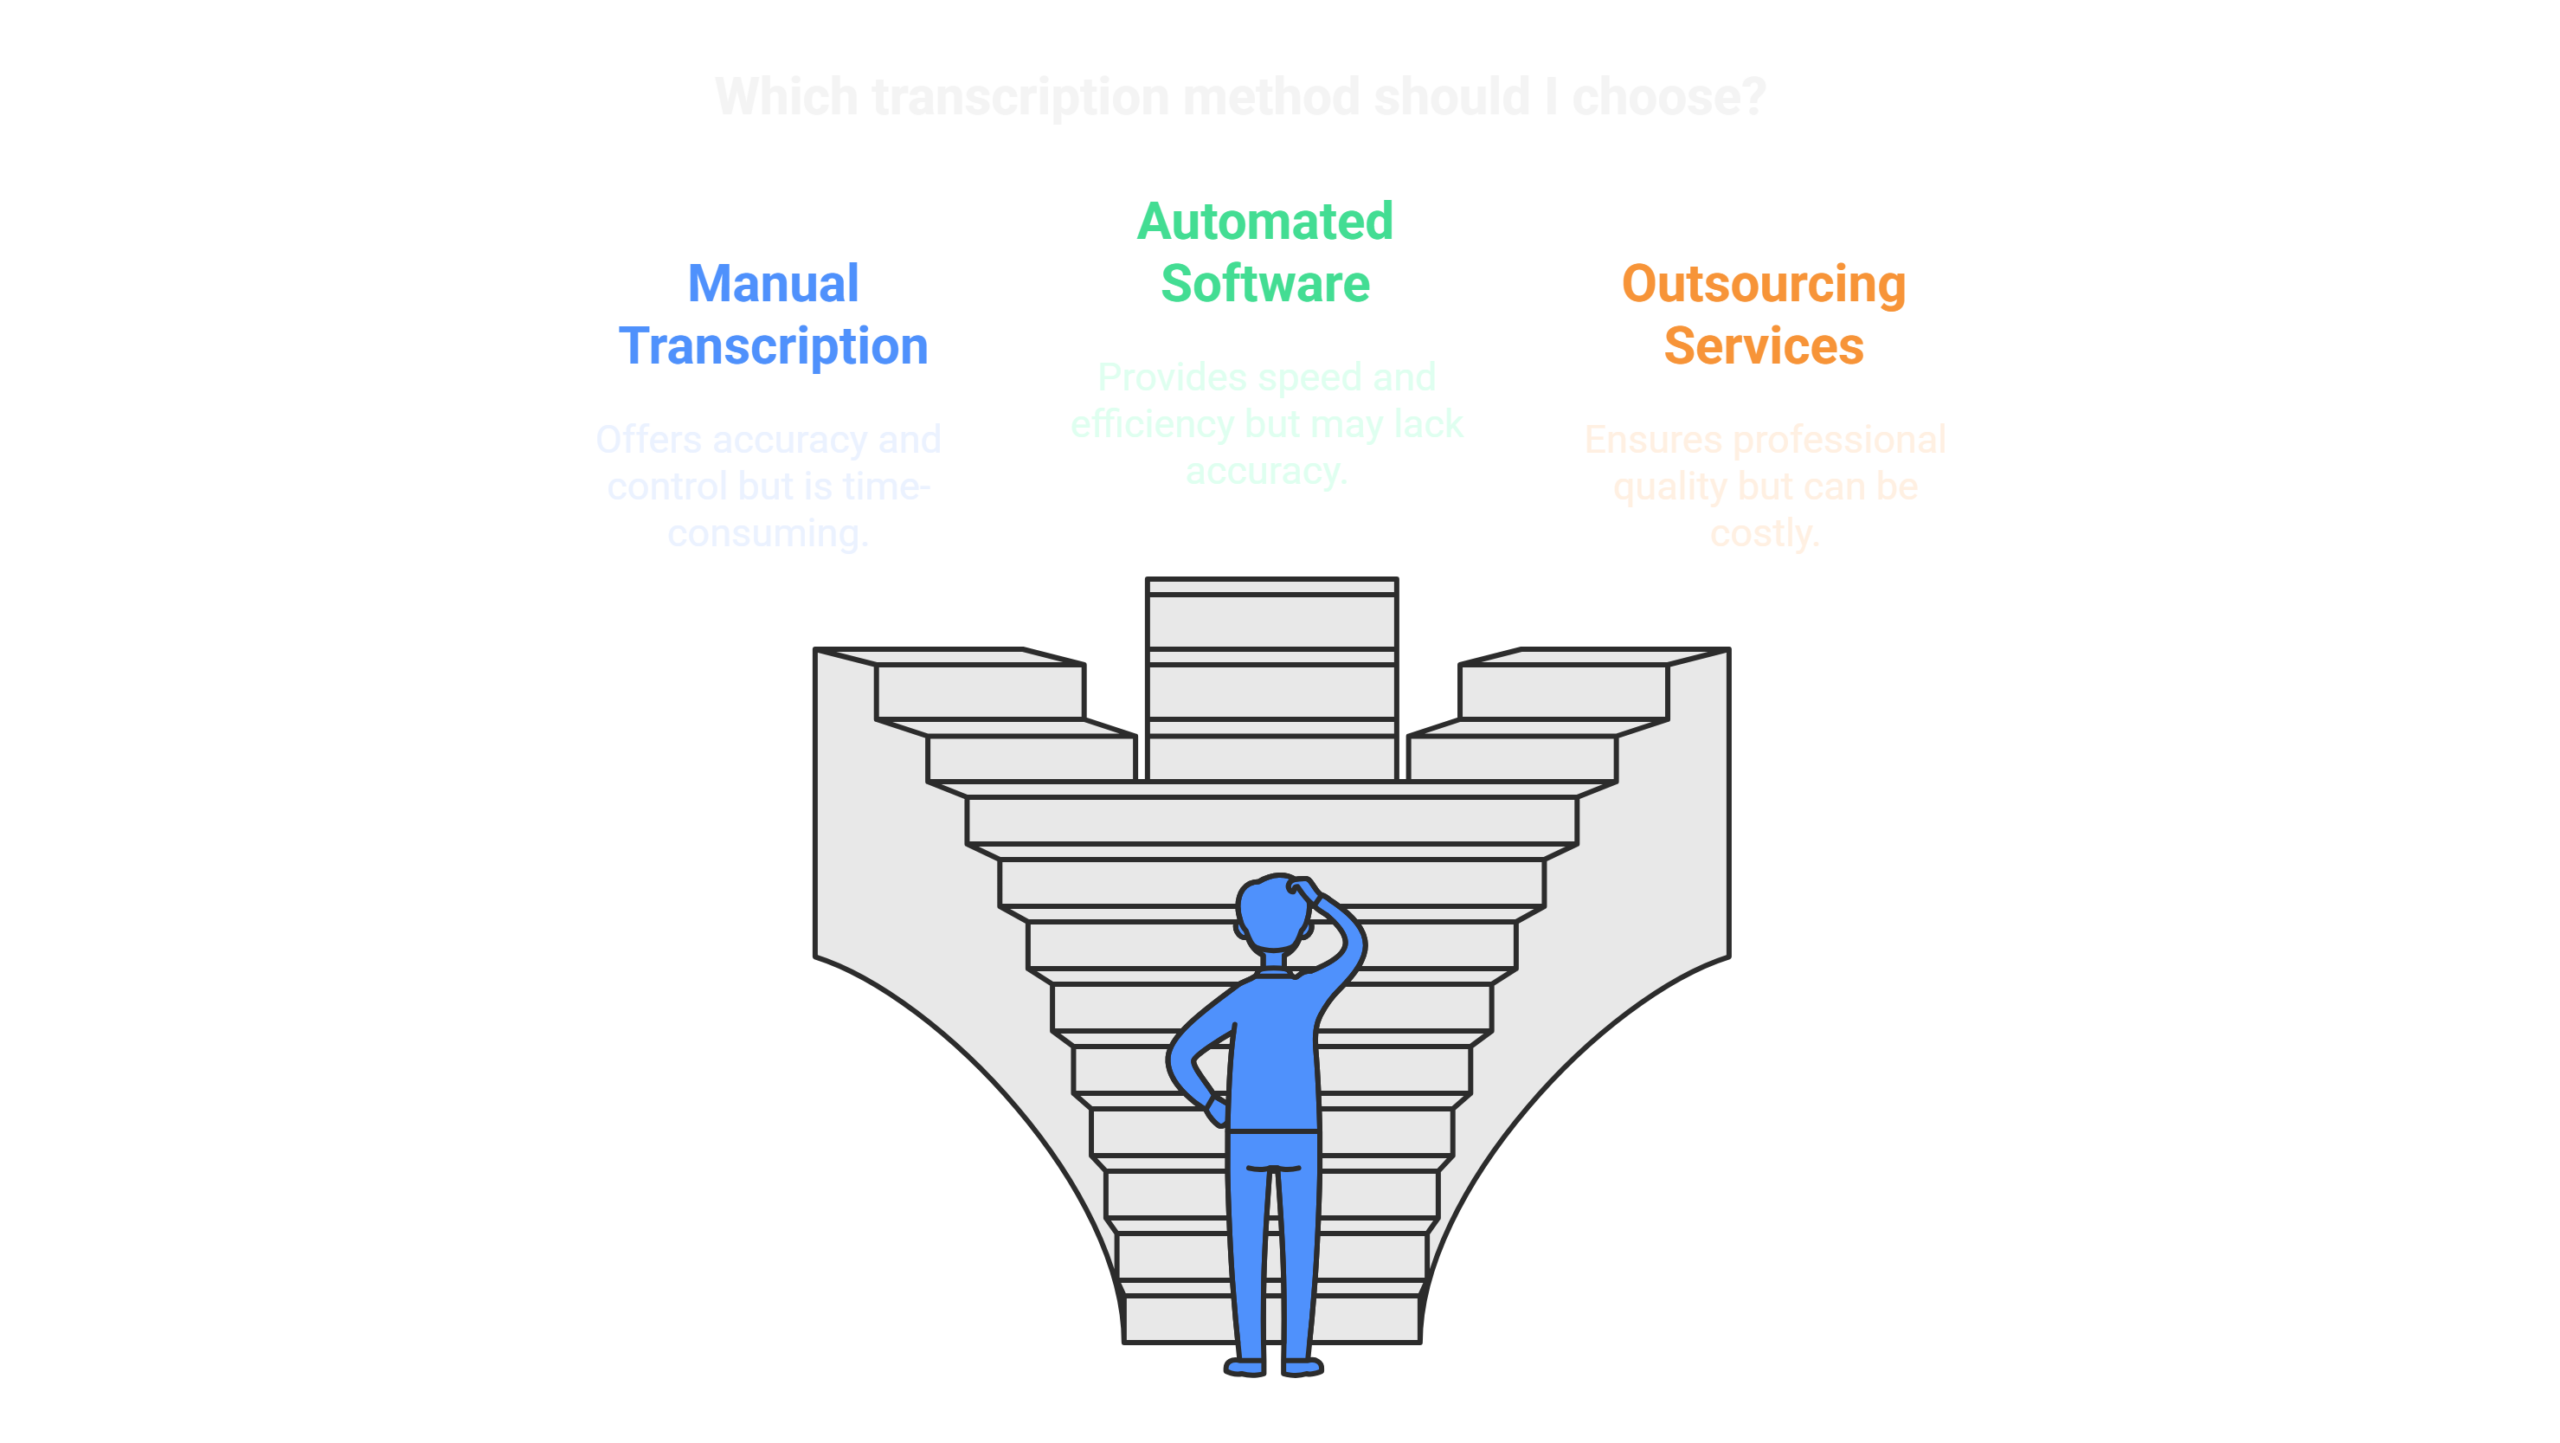
The tool generated clear and concise text with headings like “Which transcription model should users choose: manual, automated, or outsourcing?”
I selected one of the heading-based infographics and explored the customization options:
- Adjusted the aspect ratio to 16:9 for a professional widescreen format.
- Turned off the background to keep the design minimal.
- Set the resolution to 3x for high-quality output.
After editing the text, changing colors, and refining the layout, I exported the infographic as a PNG file. The process was smooth, and the final output was polished and visually appealing.
Generate High-Quality Infographics for Free with Napkin AI
One of the most striking features of Napkin AI is the capacity to create infographics for each heading or paragraph in your text. Each section of the content comes with a lightning bolt icon that, when clicked, instantly generates infographic designs. Users can avail of several styles to ensure the visuals align perfectly with their needs.
Best of all, it is free, meaning users can make professional-grade infographics free of charge. Despite being free, the infographics are of excellent quality, complete with customizable text, diagrams, and images ready for download in different formats and resolutions.
Introduction to Piktochart
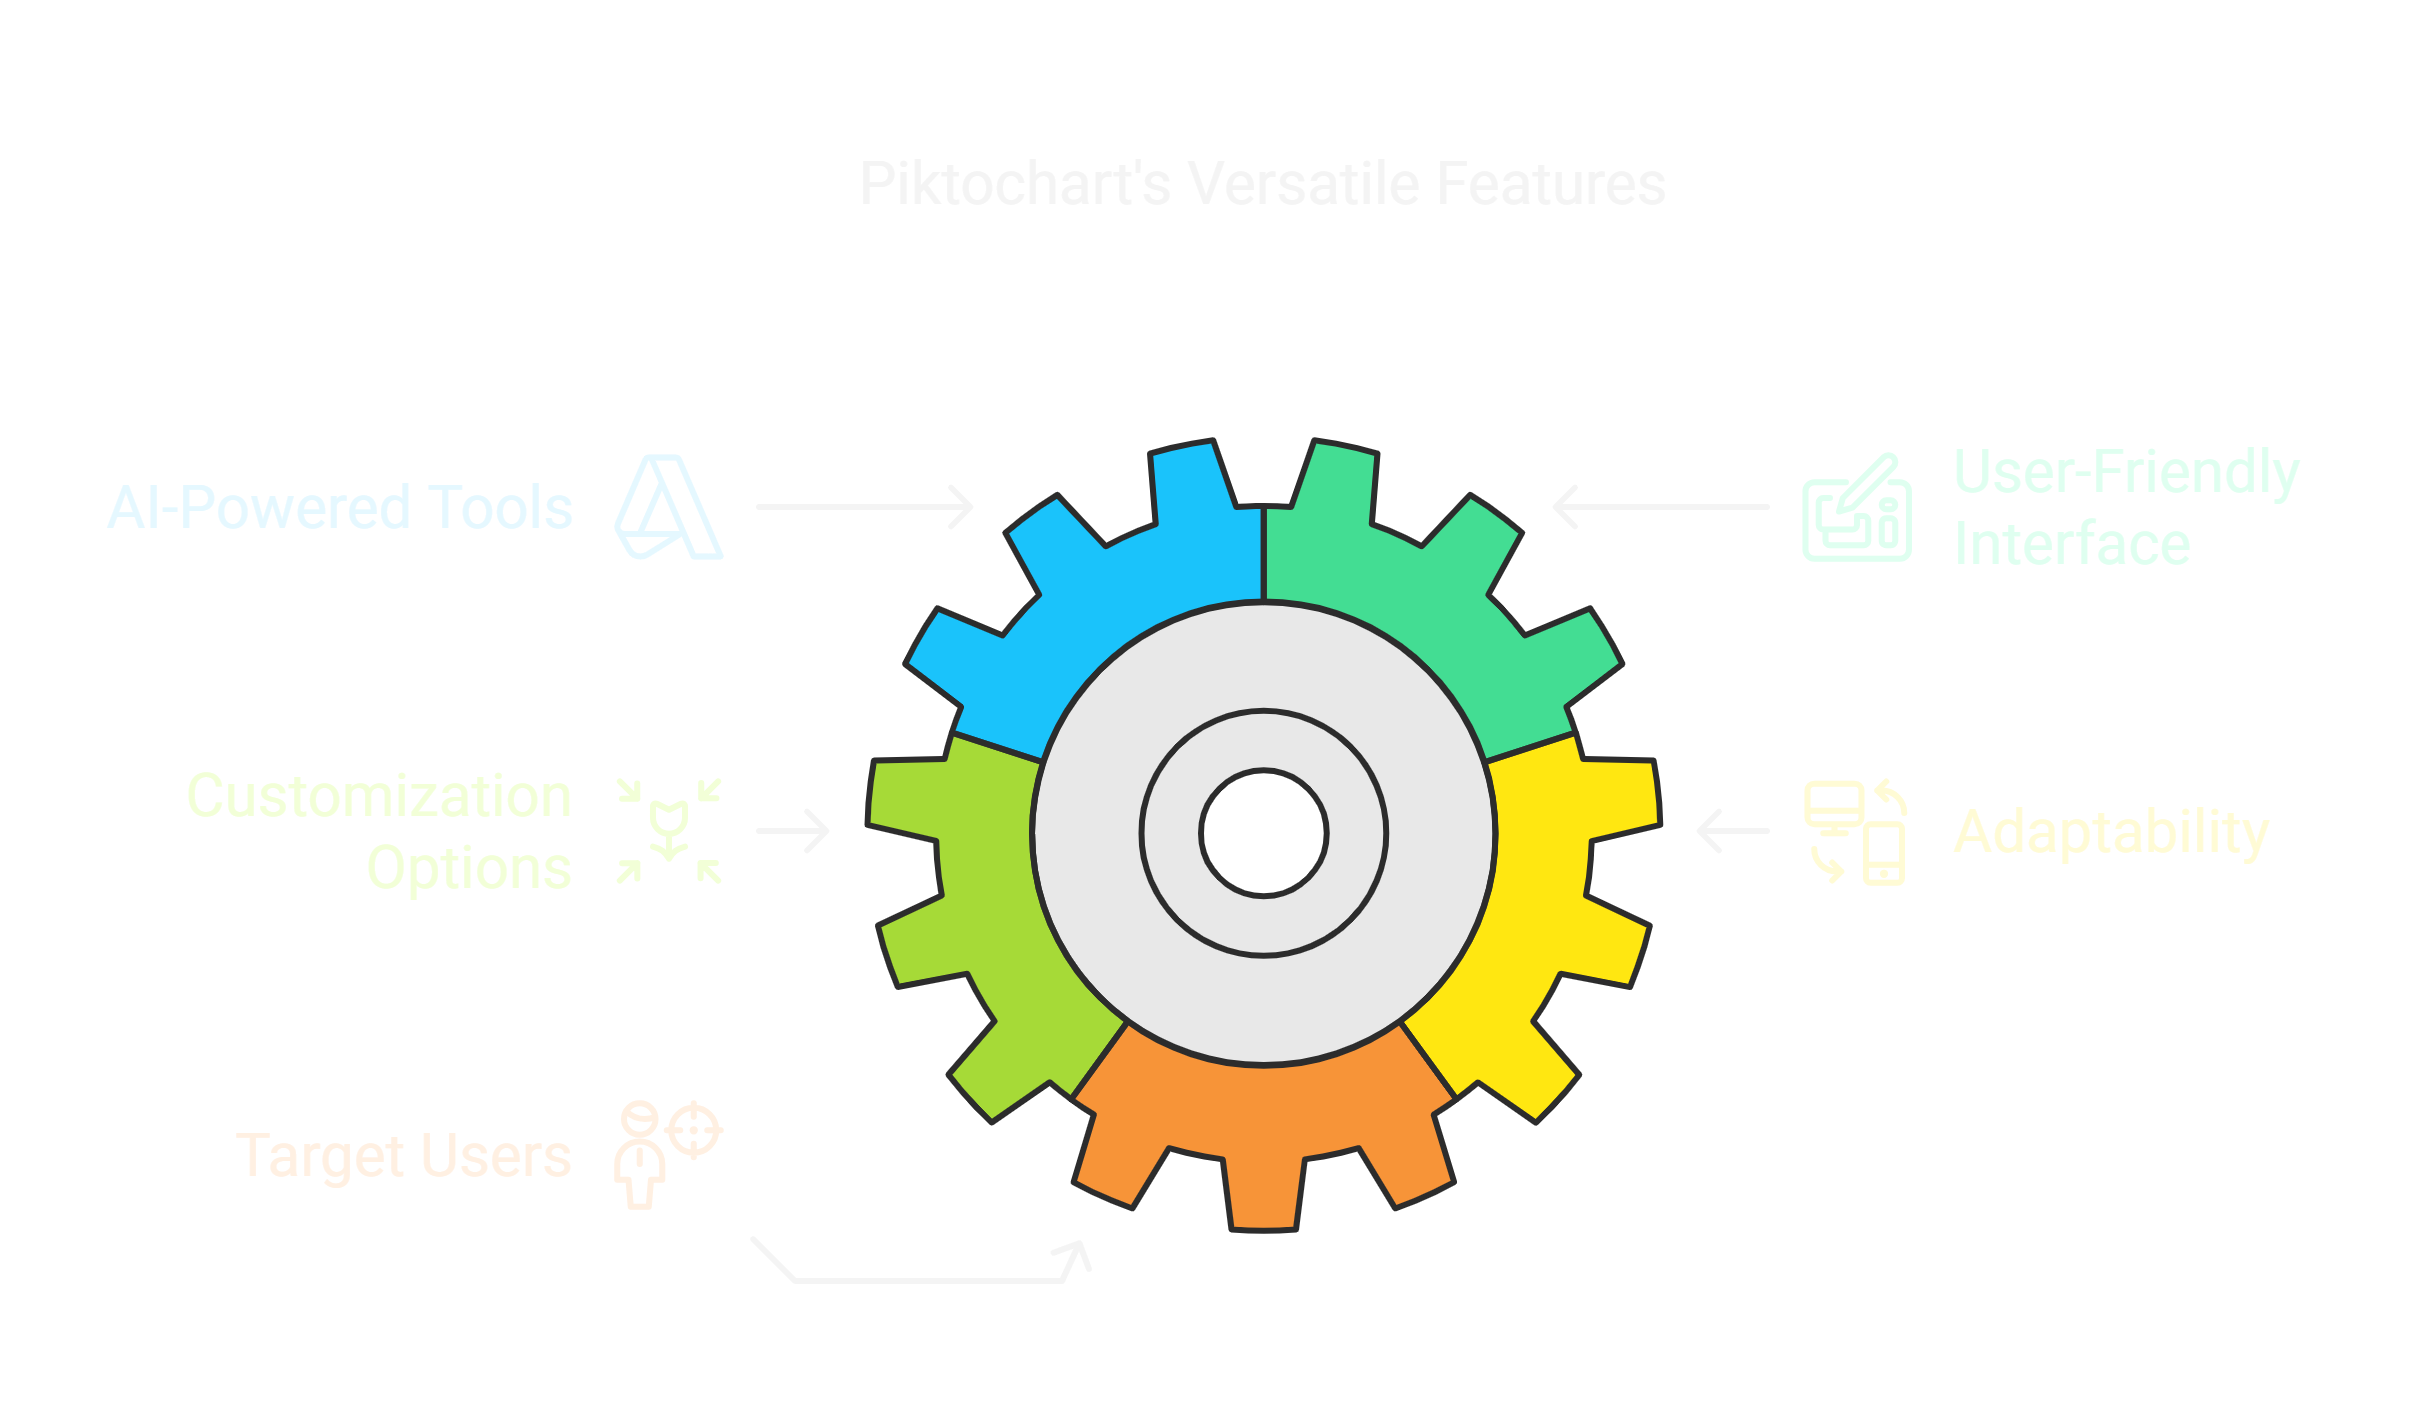
Piktochart is the most versatile AI-powered tool that enables users to make infographics free with AI tools. It provides a user-friendly basis for creating quality visuals, such as newsletters, timelines, comparisons, and charts. With much emphasis on ease of use, Piktochart caters to individuals and businesses wishing to develop catchy content for presentations, reports, or social media.
Whether you are a newbie to design or an experienced professional, Piktochart makes the work of creating an infographic easy and simple through AI-generated templates, customization options, and graphics, charts, and maps. Users may input content in several ways, making this tool adaptable to various demands.
Features and Options of Piktochart
Piktochart is full of features that make the process of infographic creation easy while still maintaining a professional touch. Here’s a breakdown of its core functionalities:
1. Getting Started:
Create or Log In Users must first create an account or log in to an existing account before getting creative. Registration is quick and done within minutes.
2. Generate AI Infographic
Once logged in, users land on the main dashboard, where the first option is “Generate AI Infographic.” Clicking on this option opens a range of infographic styles to choose from. The five available styles are:
- List
- Newsletter
- Comparison
- Timeline
- Chart (the only landscape option; others are portrait).
Each style is tailored to specific content needs. For example, the comparison style is ideal for side-by-side analysis, while the timeline style is perfect for showcasing events chronologically.
3. Input Options for Content Creation
Piktochart provides multiple ways to input content for infographic generation:
- Type a Title: Input a title, and Piktochart will automatically generate content for the selected infographic style.
- Upload a Document: Users can upload documents, and the tool extracts relevant text to create the infographic.
- Direct Text Entry: Users can manually input text for precise customization.
4. Templates for Infographics
Once the content has been created, users can pick from a host of templates. All the templates are professionally designed so that the final product is aesthetically pleasing and according to the chosen style; for example, newsletter, etc.
5. Editing and Customization
Piktochart offers extensive editing options to customize infographics:
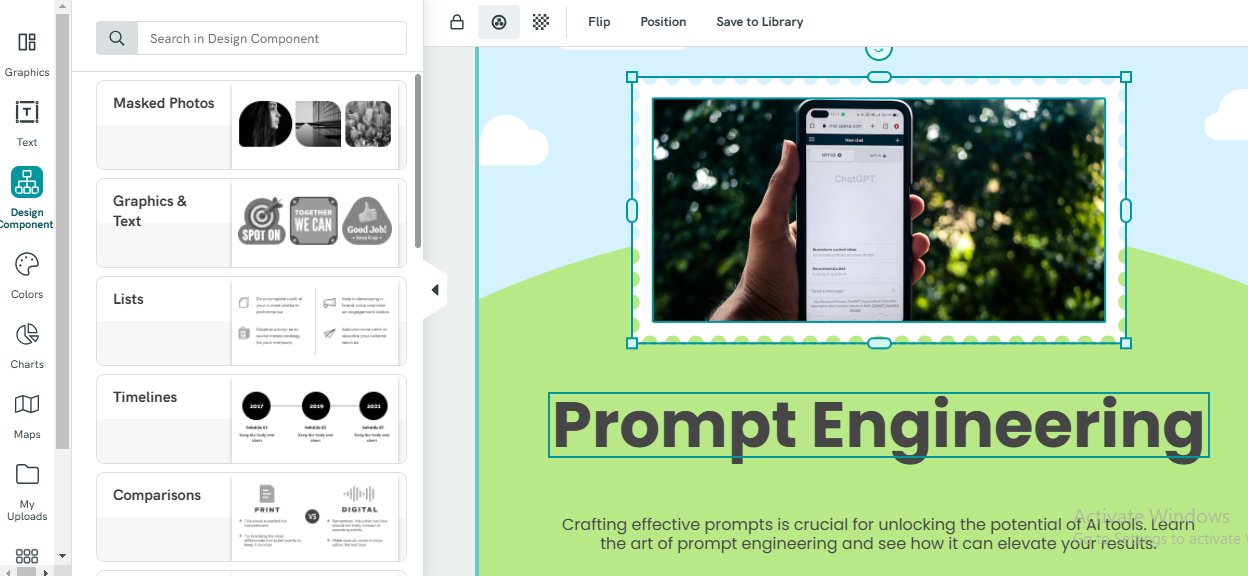
- Graphics Options: Includes basic shapes, lines, icons, illustrations, 3D models, and photos.
- Text Customization: Allows users to choose from various fonts and text styles.
- Charts and Maps: Provides options for adding charts and maps to enrich the infographic.
- Design Components: Includes pre-designed elements to enhance the visual appeal.
- Background Options: Enables changes in coloring, positioning, and the addition of clickable links.
6. Download and Export Options
Once the infographic is complete, users can download it in their preferred format:
- Formats: PNG, PDF, or PowerPoint.
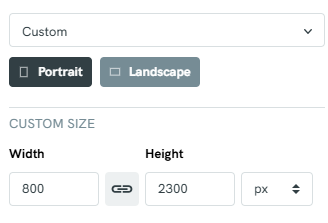
- Orientation and Dimensions: Users can select portrait, landscape, or custom aspect ratios.
- Quality Options: Choose between normal, medium, or high resolution for the final download.
Practical Work: Creating an Infographic using Piktochart
To provide an example of the use of Piktochart, I composed an infographic around an article titled
“How to Create a Perfect Prompt: Tools and Techniques”
Step by step I will explain below:
Step 1: Selecting the Infographic Style
I logged into Piktochart and selected the “Generate AI Infographic” option. From the available styles, I chose the Newsletter style in portrait orientation, as it suited the content of my article.
Step 2: Inputting the Text
Using the text input option, I pasted the content of my article into the tool. Piktochart quickly processed the text and generated a visually appealing newsletter layout.
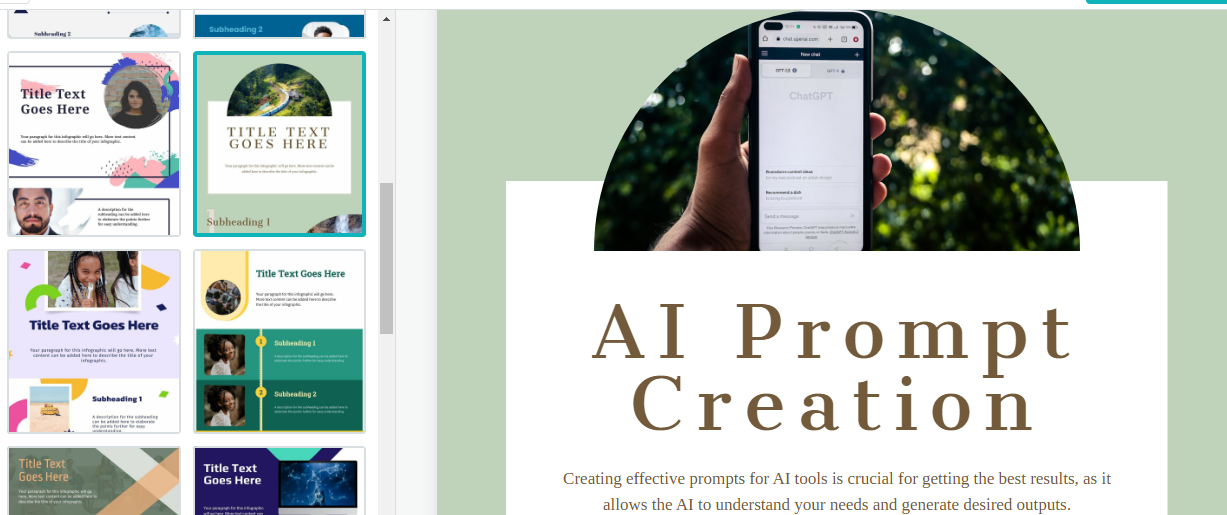
Step 3: Choosing a Template
The tool offered several template options for the newsletter style. After reviewing the templates, I selected one that aligned with my design preferences and allowed for easy readability.
Step 4: Customizing the Infographic
I customized the infographic using the following options:
- Changed Images: I replaced some default images with AI-generated images available within Piktochart.
- Edited Text: I adjusted the font style and size to emphasize key points in the article.
- Added Graphics: I included icons and illustrations from Piktochart’s library to make the infographic more engaging.
- Modified Colors: I adjusted the color scheme to match my website’s theme.
Step 5: Exporting the Infographic
After finalizing the edits, I downloaded the infographic with the following settings:
- Format: PNG.
- Resolution: High quality.
- Aspect Ratio: Portrait orientation.
The process was seamless, and the final infographic was professional and ready for use.
Important Information About piktochart’s Free Plan
Piktochart’s Free Credit System
Though Piktochart has so many features, it is operated with a credit-based system for three users
50 Free Credits:
New account holders get 50 credits.
Credit Usage:
-
- Typing a title to generate an infographic consumes 1 credit.
- Typing custom text consumes 3 credits per infographic.
- Generating AI images during editing requires 6 credits per image.
Download Limitations in Free Plan
Free users can download only two infographics. Additional downloads require a paid plan. Users can select download formats, quality levels, and aspect ratios, ensuring flexibility even within the free plan.
Click here to see the generated results
Applications of Infographics
Infographics have changed the way information is expressed. The most complex data gets easy and engaging to understand through these infographics. In today’s digital fast world, users demand quick knowledge; hence, infographics play a fundamental role.
Using tools that can generate free AI infographics saves time in content creation while the quality remains high. Let’s talk about the four best applications of infographics and how they improve communication in various industries.
1. Marketing and Advertising
Marketing lives off the delivery of powerful messages that grab attention and provoke engagement. Infographics are the best way to achieve this since they connect strong visuals with short text for the promotion of products, services, or ideas. Companies can apply infographics for:
• Presenting product features, benefits, and comparisons.
• Presenting market trends, sales data, and analytics in an appealing format.
• Creating visually rich social media posts that boost user engagement.
Marketers save time and other resources while preparing infographics as eye-catching visual materials that meet the specific demands of the campaigns. The use of AI-based tools allows one to customize various templates to get an infographic for a brand. Infographics represent the product launching or the yearly report in which the message is clear as well as beautiful.
2. Education and Training
The integration of digital equipment has transformed education, and infographics have become an integral part of modern learning. Educational institutions, trainers, and content creators continue to use infographics to make technical topics easy and interesting in the minds of learners. Some common applications include:
• Explaining difficult concepts with visuals, charts, and diagrams.
• Summarizing lengthy study materials into easy-to-understand formats.
• Designing step-by-step guides for practical learning.
Educators can easily use AI tools to generate infographics for free. They will thus be able to produce professional-looking visuals in no time, and without needing to be professional designers. The templates offered by AI tools are specially designed for educational purposes.
Therefore, the infographics generated using AI tools will not only be informative but also visually appealing. Students are more likely to retain information and stay motivated when they learn with interactive diagrams and engaging visuals.
3. Social Media and Content Creation
In social media, short attention spans prevail; infographics prove to be an effective channel for grabbing user’s interest. Highly shareable, they’re the best method of expanding reach to a message or brand. Infographics are shared among social media content creators:
• Sharing facts and statistics as well as quick tips, with the right visual attraction.
• Creating a “how to” guide or checklists to help followers
• Convey stories and trends by colorful visual narrations.
Social media creators may produce content that stands out in crowded feeds by using infographics free from AI tools with tools to create infographics. AI tools are pre-designed templates specifically optimized for integration into Instagram, Pinterest, Facebook, or LinkedIn. Customers can also adapt the designs by the brand colors and logos, in addition to a few unique aspects that would maintain a continued presence online.
4. Business Presentations and Reports
Infographics in the corporate world can help one in the process of making the most effective presentation with data. Decision-making and communicating with stakeholders require this presentation ability. Summarizing quarterly or annual performance data, business strategies, and project milestones, or showing revenue growth and market share on key metrics through infographics would be essential.
This will allow businesses to use AI tools to generate infographics free, which means numbers and raw data can be easily translated into attractive formats. Adding interactive elements, charts, and graphs to a presentation will make it not only more attractive but also ensure that the audience will better understand the data presented. Be it for clients, investors, or employees, infographics ensure that key points are conveyed in a clear and impactful manner.
Summary: Generate Infographics Free with AI Tools
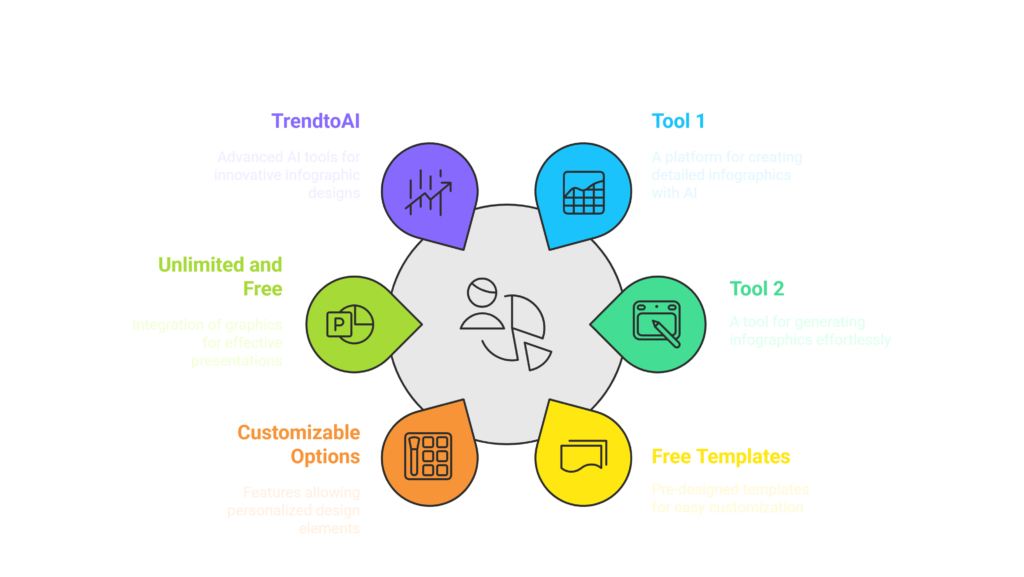
Whether you need an advertising infographic, a business infographic, or even a social marketing infographic, AI tools provide a seamless experience. Tools like Piktochart and Napkin AI allow users to generate infographics free with AI tools, offering high-quality results with minimal effort. These platforms also offer free AI graphic design templates and customizable options, making it simple to design visuals that fit your needs perfectly.
FreePowerPoint graphics can be integrated with creative ideas, for presentations ensuring a good infographic design that communicates your message effectively. If you’re wondering how to make an infographic, modern tools provide step-by-step guides to create both interactive infographic designs and static formats. Whether it’s a list graphic, the best multi-point process infographic, or even an animated version, AI tools are equipped with features to cater to every requirement.
Platforms like Piktochart excel in what defines a Piktochart: their ability to let users create infographics with AI that include diagrams, charts, and dynamic elements. You can even use these tools to produce infographic slideshows, create animated infographics, or explore creative infographic examples for inspiration.
From infographic links to infographic pictures, these tools also provide artistic infographics and customizable infographic backgrounds. The blend of information graphics with user-friendly interfaces makes them some of the best infographics websites available.
In conclusion, the ability to generate infographics free with AI tools has made data visualization accessible to everyone. Embrace these tools to create professional and impactful infographics tailored to your personal or business needs.
Author’s Insight
Sharjeel Jadoon is the visionary behind TrendtoAI, a website that is dedicated to making artificial intelligence accessible and understandable to everyone.
He sheds light on clear, practical content and strives to bridge the complex AI tools with the everyday user.
This passion for innovation goes hand in hand with the empowerment of others through knowledge. Read more…
Podcast:
If you prefer listening over reading, experience the content in an engaging podcast format. Click here to tune in now!
